GEO data downloading
(1) Directly downloading raw data — not recommended for use.
Since the raw data are freely uploaded by authors without a fixed format—for example, some are in CEL format—it is not recommended.

If the data provided directly are in the form of COUNT, FPKM, or TPM expression values, they can be read and used immediately.


(2)Download the expression matrix directly from the web page, and then read it into R

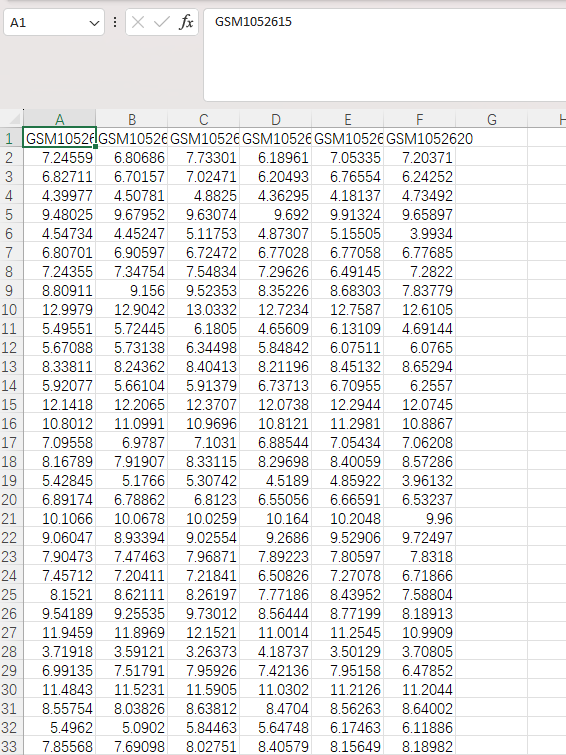
After downloading the expression matrix to your local machine, you need to load it into R and name it “a.”
					a = read.table(file="./GSE42872_series_matrix.txt.gz",
               header = T,sep = "\t",quote = "",fill = T,
               comment.char = "!")
When reading the downloaded expression matrix, why are so many parameters required for a successful download? First, we need to decompress and open the text file on the computer, and then select parameters based on the file’s structure.
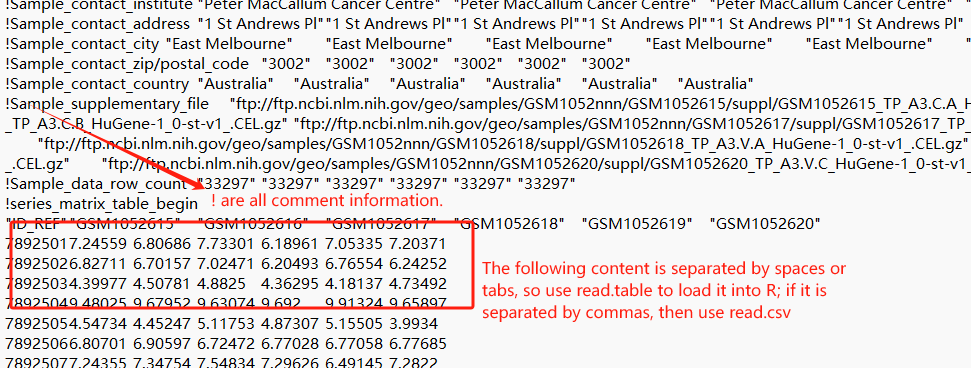
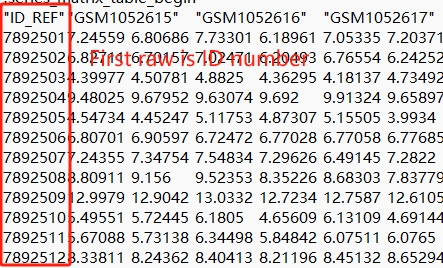
We can see that the rownames of a are row numbers, which are meaningless. They need to be converted to probe IDs, which are in the first column of a: rownames(a) = a[,1].
![R programming code using 'rownames(a) = a[,1]' to extract and assign values from the first column as row names in a data frame for bioinformatics analysis](https://bio-seva.com/wp-content/uploads/2025/03/Check-the-RNAseq-data.png)

At this point, the column names of a are the probe IDs. However, this still doesn’t meet our expectations. We also need to remove the RefSeq ID column, which is now the first column: a = a[,-1]

This is the expression matrix composed of samples and probes.
(3) Use the GSE number and the GEOquery package to directly download data from the GEO database—this is the most recommended method (especially for older data, such as those in CEL format).
In this section, we will use R for data downloading. If you are not proficient in R, they can leverage AI for assistance with code-related tasks.
Earlier, we have already set up the prompt for ChatGPT.
					library(GEOquery)
eSet <- getGEO("GSE42872",
               destdir = '.',  #Download in the current directory.
               getGPL = F) #No Platform information
Note: Sometimes, the author did not consider if the downloaded series_matrix does not contain sample expression information, this method will directly fail.

By using the above code, you can download the GSE42872 data into the current working directory in R and assign it to eSet. After downloading, it is important to check the integrity of the data file—verify whether the size of the downloaded data is greater than or equal to the size provided on the official website. If the downloaded data size is larger than the official size, it’s fine; if it’s smaller, the downloaded data is incomplete.
Question: What is the solution if the downloaded data size is smaller than the official size?
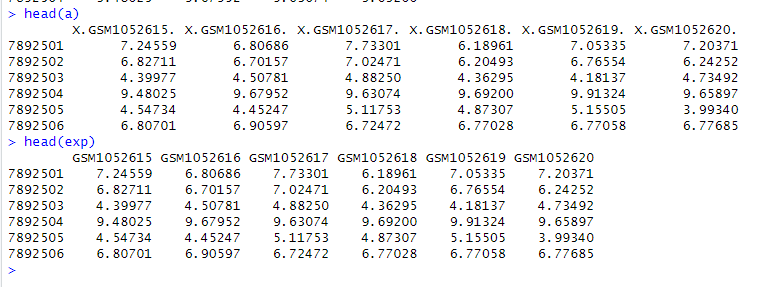
The a downloaded using Method 2 and the eSet downloaded using Method 3 are both GSE42872 data, but they are different:

We can see that a is a data frame, while eSet is a list—here we refer to it as an object. The eSet object contains various types of information: the expression matrix, how the chip was designed, how the samples were grouped, and so on. eSet is a large list, and we need to extract the expression matrix from it to proceed with subsequent operations. Why? Because a single GSE number may correspond to data from multiple chip platforms. When we download data using the GSE number, all platform data are consolidated into a single list, with each element of the list storing the expression matrix of one platform. Since our data is from only one platform, the eSet list contains only one element:
Use the method of subsetting a list to extract the first element of the eSet list: eSet[[1]]; then, use the exprs function to convert it into a matrix: exp <- exprs(eSet[[1]]).
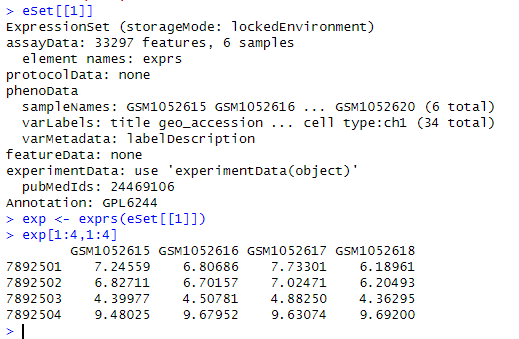
At this point, we can see that the expression matrix a obtained from Method 2 and the expression matrix exp (we transformed eSet into exp) obtained from Method 3 are exactly the same:
Now that we have successfully downloaded the expression matrix data, we will use the write command to save it locally.
write.csv(exp, file = "GSE42872.csv", row.names = FALSE)
